Industrial Event Normalization
Industrial teams need to know what happened to which asset and why it matters. Packet-oriented logs usually answer a different question: which protocol fields were decoded. L2Proxy's Industrial Event Normalizer bridges these views by translating parsed DNP3 traffic into human-readable, asset-aware, consistently classified events.
Customer outcome: turn protocol detail into an operational record that a control room, maintenance team, OT SOC, investigator, dashboard, and SIEM can use directly.
Before and after
| Parser-level evidence | Industrial event |
|---|---|
src=1, dst=3, function 5, G12V1, index 0, Latch On / Close |
SCADA Master sent DIRECT OPERATE: Close command to CB-101 (breaker) on RTU-South — F12 circuit breaker control |
The readable sentence does not replace technical evidence. The normalized record keeps network identity, function code, operation, raw point structure, mapped asset context, criticality, and discovery status beside the description.
Processing model
OT traffic / stored capture
          ↓
l2proxy-dissector protocol inspection
          ↓
raw PostgreSQL JSONB records
          ↓
Industrial Event Normalizer
  ├─ classify operation and significance
  ├─ map devices and points to site assets
  ├─ preserve raw process-point evidence
  ├─ identify unknown devices and points
  └─ generate an industrial-language description
          ↓
industrial_events + JSON lines
          ↓
control-room view / OT SOC / reports / SIEM / investigation
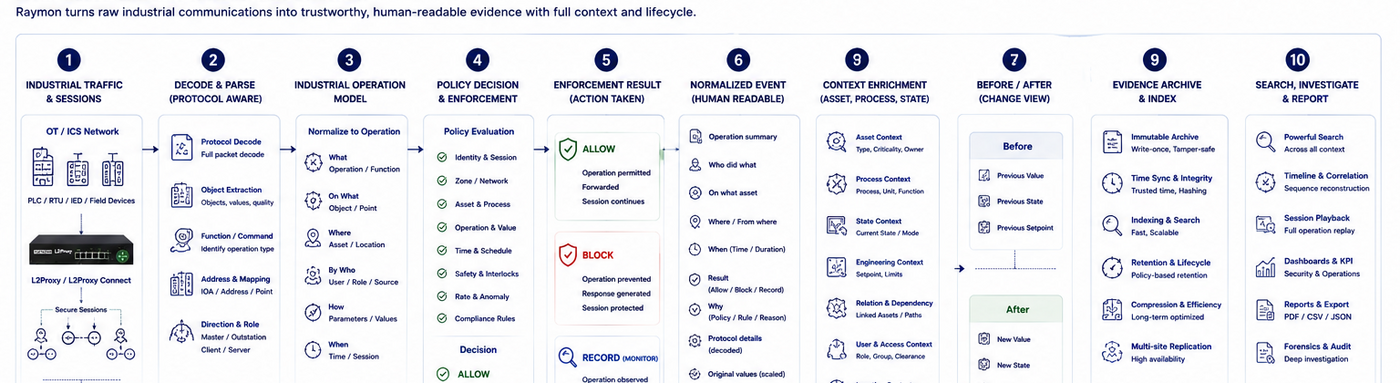
Figure — Normalization sits inside the broader industrial evidence processing model.
The raw and normalized stores serve different purposes. See Event Archive and Evidence for retention, correlation, duplicate-aware queries, and the deployed database model.
Consistent classification dimensions
The normalizer emits separate fields—often used as operational tags—rather than one ambiguous label:
| Field | Current values or examples | Operational use |
|---|---|---|
protocol |
dnp3 |
Protocol scope |
event_type |
control_command, control_sequence, monitoring_read, response, unsolicited_event, confirmation, configuration_change, maintenance_command, fragment, generic |
Precise event workflow |
category |
control, monitoring, response, event, configuration, maintenance, other |
Dashboard and routing group |
severity |
low, medium, high, critical |
Prioritization |
operation |
select, operate, direct_operate, read, write, response, cold_restart, and others |
Protocol operation |
critical |
Boolean from asset context | Customer-designated critical asset or point |
alarm |
Boolean raised for selected health/IIN or mapped alarm conditions | Alarm routing |
sequence |
For example select_operate |
Control workflow context |
| discovery flags | unknown source, destination, or point | Asset inventory review |
| asset dimensions | asset ID/type, point key/type/index, action, value, unit, intent | Process-aware search and correlation |
These dimensions allow different consumers to use the same record. A control-room view
can focus on category=control; an OT SOC can route severity=critical; engineering can
query a point or asset; and asset owners can review unknown-device reports.
Severity, criticality, and alarm are different signals
| Signal | Source | Meaning |
|---|---|---|
severity |
Normalizer classification, with escalation from selected IIN and mapped data | How urgently this event should be reviewed |
critical |
Customer asset-map designation | The event involves a site-designated critical point or asset |
alarm |
Critical device-health indication or an alarm-designated mapped point | The observed message carries an alarm condition |
Keeping these fields separate supports useful combinations: a routine response can
contain a critical asset value; a maintenance restart is critical severity even without
a mapped point; and an unsolicited event can be both critical=true and alarm=true.
Current DNP3 classification
| DNP3 message | Event type | Category | Default severity |
|---|---|---|---|
| Direct Operate / Operate | control_command |
control |
high |
| Select | control_sequence |
control |
medium |
| Read | monitoring_read |
monitoring |
low |
| Write | configuration_change |
configuration |
medium |
| Cold / Warm Restart | maintenance_command |
maintenance |
critical |
| Enable / Disable Unsolicited | configuration_change |
configuration |
low |
| Response | response |
response |
low, escalated by IIN or critical mapped data |
| Unsolicited Response | unsolicited_event |
event |
medium, escalated by health or critical mapped data |
| Confirm | confirmation |
response |
low |
| Reassembly fragment / other | fragment / generic |
other |
low |
Critical DNP3 IIN indications such as device restart, device trouble, configuration
corruption, or event overflow can elevate a response to critical and set alarm=true.
Selected protocol errors and local-control states are retained at an appropriate lower
priority for review.
Customer asset mapping
A YAML asset map turns protocol identifiers into site vocabulary:
version: "1.0.0"
protocol: dnp3
domain: distribution_dispatching

devices:
  - dnp3_address: 1
    name: SCADA Master
    role: master
    ip: 10.10.1.10

  - dnp3_address: 3
    name: RTU-South
    role: outstation
    ip: 10.10.1.100
    location: South Substation

point_maps:
  outstation_3:
    - point_key: "3:CROB:0"
      asset_id: CB-101
      asset_type: breaker
      point_type: CROB
      intent: F12 circuit breaker control
      critical: true
Maps can carry device name, role, kind, IP, location, and trust level, plus point asset identity, type, intent, unit, criticality, alarm designation, and customer metadata. The customer remains the authority for this process meaning.
One record for people and systems
{
  "protocol": "dnp3",
  "event_type": "control_command",
  "category": "control",
  "severity": "high",
  "industrial": {
    "src_device_name": "SCADA Master",
    "dst_device_name": "RTU-South",
    "dst_device_location": "South Substation",
    "operation": "direct_operate",
    "asset_id": "CB-101",
    "asset_type": "breaker",
    "point_key": "3:CROB:0",
    "action": "Close",
    "critical": true
  },
  "description": "SCADA Master sent DIRECT OPERATE: Close command to CB-101 (breaker) on RTU-South — F12 circuit breaker control",
  "process_assets": [
    {
      "raw": {
        "group": 12,
        "variation": 1,
        "index": 0,
        "point_key": "3:CROB:0",
        "point_type": "CROB",
        "crob": {"tcc": "Close", "opcode": "Latch On", "count": 1}
      },
      "mapped": {
        "found": true,
        "asset_id": "CB-101",
        "asset_type": "breaker",
        "intent": "F12 circuit breaker control",
        "critical": true
      }
    }
  ]
}
process_assets is important when one frame contains several points. Each entry keeps
the raw group, variation, index, point type, value/state or CROB, quality, and event time
beside its mapped asset. A dashboard can use readable names while an investigator retains
the protocol-level evidence needed to verify the interpretation.
See the complete normalized control example. For a broader customer-oriented set covering control, monitoring, health, configuration, and discovery, continue to its Industrial Event Gallery.
Unknown assets become actionable evidence
Normalization continues when a device or point is not in the asset map. The event uses
a generic DNP3 identity and marks unknown_src_device, unknown_dst_device, or
unknown_point. This supports a controlled discovery cycle:
- observe traffic without requiring a complete initial inventory;
- rank unknown devices and points by occurrence and first/last seen;
- validate them with site engineering;
- add approved identities and process meaning to the asset map;
- reprocess historical data or continue with richer live descriptions.
Discovery means “not present in the supplied map,” not automatically “malicious.”
Live, historical, and commissioning workflows
| Mode | Behavior | Typical use |
|---|---|---|
| Tail | Polls new raw records and writes/prints normalized events | Near-real-time operations and monitoring |
| Batch | Processes a bounded historical set | Investigation, reporting, and map enrichment |
| Dry run | Normalizes without writing output rows | Commissioning and validation |
| Generic map | Runs without site mappings | Early discovery and parser-level operational descriptions |
The default tail poll interval is two seconds and is configurable. This is a near-real-time event pipeline, not deterministic process-control timing.
PostgreSQL reporting model
Normalized events are stored in industrial_events with indexed time, protocol,
event type, severity, device, asset, point, source/destination IP, discovery flags,
and JSONB process assets. Provided views answer common operational questions:
| View | Customer question |
|---|---|
recent_critical_events |
What high or critical activity occurred in the last 24 hours? |
control_commands_summary |
Which control commands were observed in the last seven days? |
asset_discovery_report |
Which unmapped devices appeared, where, and how often? |
point_discovery_report |
Which unmapped process points were observed? |
SELECT timestamp, master, outstation, asset_id, action, description, critical
FROM control_commands_summary
ORDER BY timestamp DESC;
PostgreSQL 12 or later is required. JSONB and INET are native types; no separate
database extension is required. Credentials should be supplied through deployment
secrets, not committed to a repository or embedded in customer documentation.
Industrial use cases
- command audit by master, outstation, asset, action, shift, or site;
- separation of routine monitoring from control and maintenance activity;
- immediate review of cold/warm restart and critical IIN health indications;
- reconstruction of Select/Operate, response, unsolicited update, and confirmation;
- control-room and OT-SOC dashboards using the same normalized record;
- faster forensic search without discarding raw parser evidence;
- progressive completion of an incomplete device and point inventory;
- correlation with Rule Engine decisions and customer-selected rule
metadownstream.
Scope and qualification
The current executable activates DNP3 normalization only. The Normalizer interface
supports adding protocol-specific implementations, but Modbus, S7comm, IEC 104,
Profinet, and other dissectors must not be represented as normalized until their own
implementation and traffic qualification are complete.
Normalized severity is an initial product classification. Site criticality, operational alarm policy, maintenance windows, asset taxonomy, and escalation ownership must be agreed with the customer. Normalization does not replace raw evidence, safety functions, process interlocks, or Rule Engine enforcement.
Why this is a competitive advantage
Many tools stop at packet fields or generic security alerts. L2Proxy keeps that technical evidence while adding site asset identity, operational meaning, consistent classifications, human-readable descriptions, structured multi-point context, discovery signals, and ready-to-query storage. The result shortens the distance between network observation and an operational decision without hiding how the interpretation was produced.